

If you are creating Insights reports that do not include pre-made elements, you might need to build a custom metric. You can write MAQL (Multi-Dimension Analytical Query Language) in Insights' Advanced Metric Editor to create custom metrics.
This tip provides an overview of building your own custom metrics. For more in-depth information on using the Advanced Metric Editor, see GoodData's documentation Get Started with Using MAQL to Write Metrics. For additional resources on using Insights, see Insights resources (Professional and Enterprise) .
This tip contains the following sections:
Navigating to the Advanced Metric Editor
This section will discuss how to open the Advanced Metric Editor in GoodData.
-
Click the Reporting icon (
 ) in the agent interface, then open the Insights tab.
- Click the GoodData link in the upper right corner.
- Click Reports .
- Click Create Report .
- In the What menu, click the (advanced) link next to Add new metric .
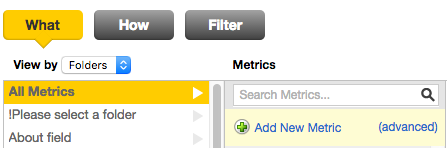
- Select Custom metric .

You will now be redirected to the Advanced Metric Editor.
Writing custom metrics
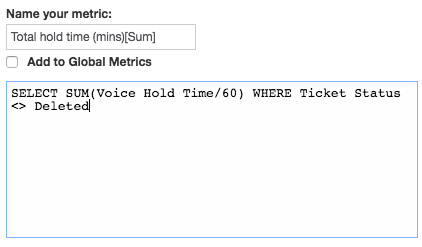
This section will discuss how to enter formulas in the Advanced Metric Editor. After you click Custom metric , you will be redirected to the Advanced Metric Editor as shown below.

- Enter a name for your metric in the Name your metric text box.
- Check the Add to Global Metrics box to access your metric in any of your reports. If you want the metric to only be available in the current report, leave unchecked.
If you check Add to Global Metrics , choose a folder to store the metric in. You can then edit the format of your metric in the Format string box. You can define the number of decimal places or add a % suffix to format the metric as a percentage.
- Enter your MAQL formula into the Editor pane directly below Add to Global Metrics . If you are not familiar with writing MAQL in the Editor pane, see Using the Editor pane below.
- Click Add .
Using the Editor pane
In the Editor pane, you can write your MAQL to build your custom metric. All metrics begin with SELECT.
Below the Editor pane, there is a list of functions you can apply to the facts, metrics, and attributes in your metric. Each function contains a definition, and you can click on a function to add it to your report.

You cannot directly type in your facts, metrics, and attributes, but instead must select from the Elements menu.

The Elements menu contains the following folders:
- Facts: Raw numbers from your data
- Metrics: Existing queries
-
Attributes: Date fields and text fields
-
Attribute Values: A choice for an attribute. For example, the attribute Color could contain attribute values such as Red, Green, or Blue.
-
Attribute Labels: The name of the attribute field. In the example above the label would be "Color".
-
Variables: These permit metrics to be dynamic, based on the user who is viewing the metric.
Once an element is added to the custom metric formula, it will automatically be color coded. Facts will be blue, metrics will be green, attributes and attribute labels will be purple, attribute values will be orange, and variables will be light brown.
For a full list of MorgWard Insights metrics and objects, see Insights metrics reference and Insights objects reference
To add an element to your report
- Click on the folder containing the element you would like to add.
- Choose the element or elements to add.
- Click the + Add Selected button at the top of the panel or double-click the element.
Avoiding common mistakes
Below are some common mistakes users make when creating custom metrics and how to avoid them.
When creating custom metrics, one common mistake is copying and pasting formulas directly from a plain-text document. For a custom metric to work, you must choose your metrics and attributes from the Elements panel. Typing out element names or copying and pasting from a different source will not be successful.
The image below displays a copied and pasted formula. This formula is incorrect.
The image below displays a formula that uses the Elements menu to add objects. This formula is correct.

Another common mistake is missing matching parentheses. If you are creating a query that is more complicated than a single aggregated action, you should be careful with your parentheses and make sure that sub-queries are properly nested. If your query contains any missing parentheses, it will be incorrectly interpreted. If you are creating a complicated custom metric, it might be easier to break your custom metrics into pieces.

The last common mistake for creating your custom metrics is syntax errors. If you receive a red error message when clicking the Add button at the bottom of the editor, you might need to check your syntax for any extra characters and spaces, missing parentheses, or incorrect elements. For example, extra hashtags or misplaced commas are common mistakes. Before submitting and saving your metric, you should carefully double check your syntax, look for extra characters and spaces, make sure you have the right parentheses, and have chosen the proper values from the right hand side.

For some examples of sample reports, see Insights recipes reference . You can use these recipes as practice for building and replicating custom metrics. For definitions of all available Insights elements, see Insights objects reference and Insights metrics reference .
Comments
0 comments
Please sign in to leave a comment.