

One of the metrics most frequently used to track agent performance is the number of tickets solved, but do solves paint the whole picture? This tip will help pull back the curtain on agent contributions when the agent is not the assignee.
Your agents make a valuable contribution whenever they communicate with an end-user. In some cases, a ticket might require the attention of several agents. Each touch in the chain advances the ticket one step closer to resolution. So in addition to the tickets your agents solve, it's helpful to look at the number of tickets where they contributed to a solution.
For this level of detail you'll need to use the Updates dataset. Ticket updates enable you to create a metric that counts the number of tickets where your agents made a public comment, but aren’t the current assignee.
This tip covers the following topics:
Creating your metrics
To begin you'll need to create two custom metrics.
The following are the two metrics you will need to create:
# Solved Tickets Assigned to Updater
The first custom metric measures the number of tickets in the solved or closed status where a given updater has made a public comment and is the current assignee.
To create the # Solved Tickets Assigned to Updater metric:
- Click the Reporting icon (
 ) in the agent interface, then open the Insights tab.
 - Click the GoodData link in the top right corner.
- Click Reports > Create Report .
- In the What panel, click Add New Metric .
- In the Simple Metric Editor panel, click the Advanced Metric Editor link at the bottom.
- Select the Custom metric option. You will automatically be redirected to the Custom Metric Editor .
- Enter a name for your metric
- Check the Add to Global Metrics box, and select a folder from the drop-down list.
- Enter in the following formula:
SELECT IFNULL(COUNT( Ticket Id , Ticket Updates ), 0) WHERE Ticket status IN( Solved , Closed ) AND Updater ID(fact) = Assignee ID (Fact) AND Updater Role IN ( Agent , Admin )

Please note, you cannot copy and paste the formula. You must select the items below from the Elements drop-down list:
- Ticket Id, Ticket status, Ticket Updates, and Updater Role are under Attributes.
- Solved and Closed are under Attribute values > Ticket Status.
- Updater ID(fact) and Assignee ID (Fact) are under Facts.
- Agent and Admin are under Attribute values > Updater role.
- Click Add when you are finished entering the formula.
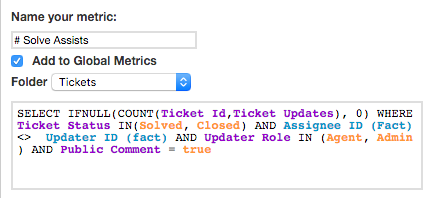
# Solved Tickets Assisted by Updater
This metric will count the number of tickets where an updater made a public reply but was not the assignee.
To create the # Solved Tickets Assisted by Updater metric:
- In the Simple Metric Editor > Advanced Metric Editor , select the Custom metric option.
- Enter a name for your metric.
- Check the Add to Global Metrics box, and select a folder from the drop-down list.
- Enter in the following formula:
SELECT IFNULL(COUNT( Ticket Id , Ticket Updates ), 0) WHERE Ticket status IN( Solved , Closed ) AND Updater ID(fact) <> Assignee ID (Fact) AND Updater Role IN ( Agent , Admin ) AND Public Comment = true
Please note, you cannot copy and paste the formula. You must select the items below from the Elements drop-down list:
- Ticket Id, Ticket status, Ticket Updates, Updater Role, and Public Comment are under Attributes.
- Solved and Closed are under Attribute values > Ticket Status.
- Updater ID(fact) and Assignee ID (Fact) are under Facts.
- Agent and Admin are under Attribute values > Updater role.
- true is under Attribute values > Public Comments.
- Click Add when you are finished entering the formula.
Building your report
After you finish creating your custom metrics, you can begin to build your report.
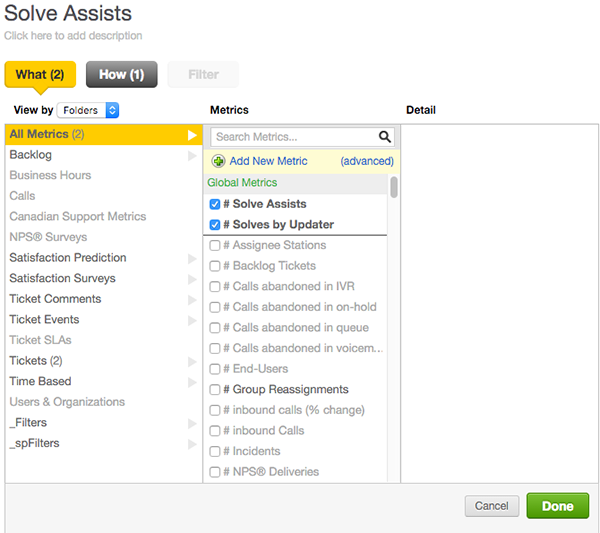
- In the What panel, ensure that your custom metrics are selected.
- In the How panel, select the Updater attribute. The custom metrics used in this report will only function when you use this attribute.
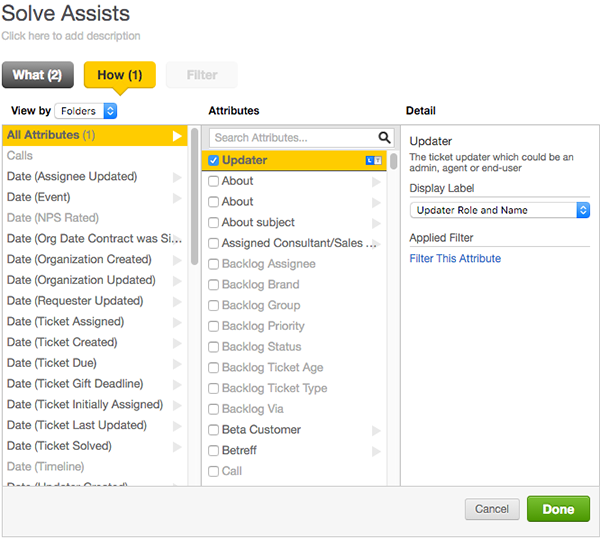
- Adjust the display label in the Detail column.
- Click Done .
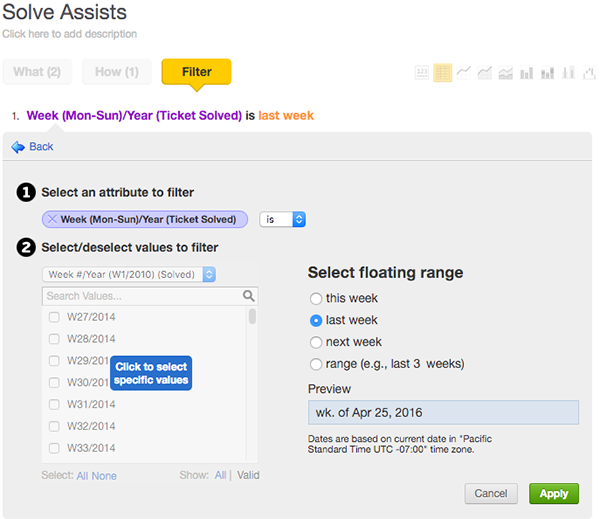
- Click the Filters button to create a new filter.
- Select the Select from a List of Values filter.
- For your attribute to filter select Week(Mon-Sun)/Year(Ticket Solved) . For the floating range select last week . This filter will capture solves from the previous calendar week.
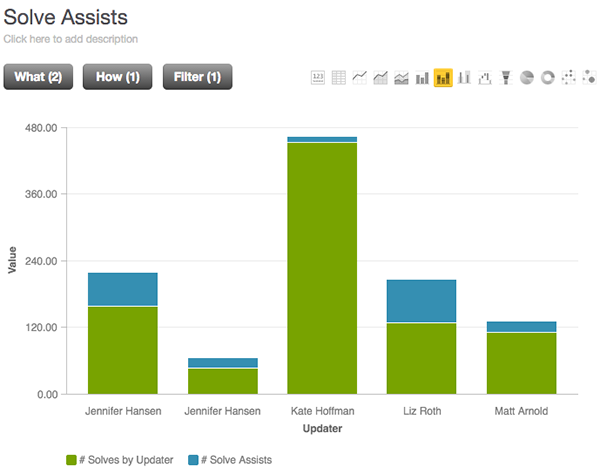
- Your report will initially be displayed as a table, but the stacked bar chart is the recommended choice. Click the stacked bar chart icon to change your chart type.
Your report should resemble the image below:
Displaying totals
The report looks pretty good, but wouldn't it be nice to see the total of solves and solves assist right on the chart? If you want to add totals to your report, you can follow the steps below.
- In the upper right hand corner, click the Show configuration link.
- Underneath Advanced Configuration , click the + button next to Global Settings to expand the menu.
- Check the Data Labels and Totals boxes.
- Uncheck the Values box.
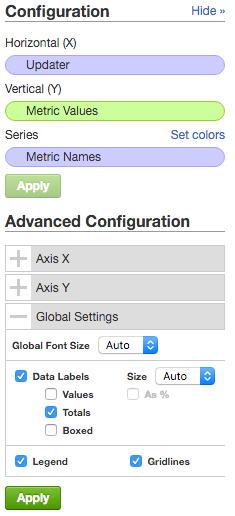
- Click Apply to save the configuration changes.
Your report should resemble the image below:
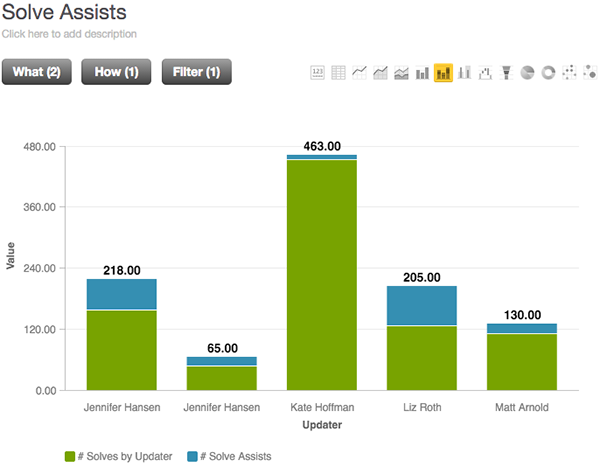
You did it! Now you can bring a little more nuance to your analysis of agent performance and recognize agents for all their contributions.
Hopefully you've been inspired to see what kinds of questions you can answer by digging into your tickets using the updates data set.
Comments
0 comments
Please sign in to leave a comment.