
Insights has now been removed for most customers. If you used Insights before, you'll now need to move to Explore, the latest generation of reporting for MorgWard products.
This recipe provides a quick way to see a breakdown of how many unsolved tickets (tickets not in a solved or closed status) are assigned to each group within your account.
Your final report will resemble the image below:

Skill level: Easy
Time Required: 10 minutes
Ingredients:
- One built-in metric
- One attribute
- One bar graph
- One final report
Building your report
- Click the Reporting icon (
 ) on the sidebar, then select the Insights tab.
 - Click the GoodData link in the top right corner.
- On the top menu, click Reports>Create Report.
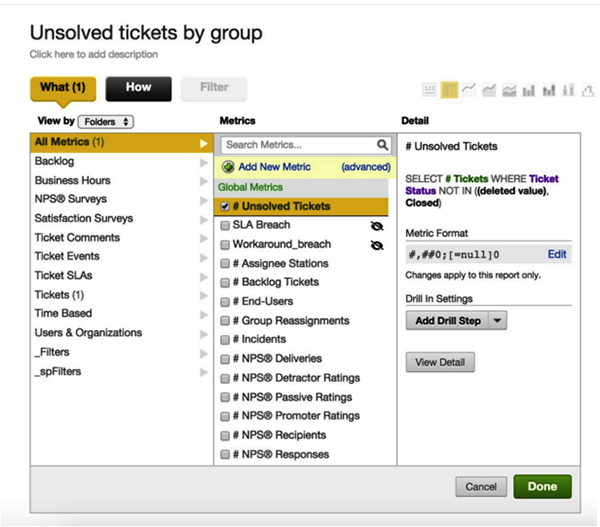
- Open the What panel, then select # Unsolved tickets from the metrics list.
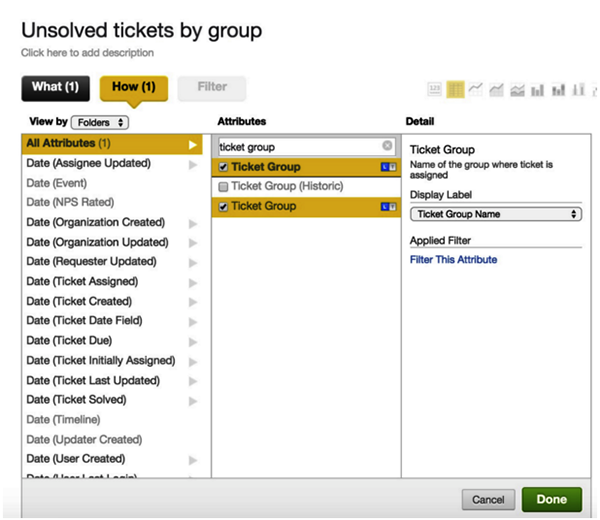
- Open the How panel, then select Ticket Group from the attribute's list.
- Click Done
Customizing your report
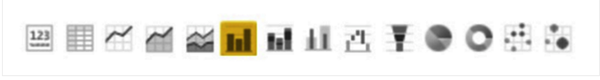
- Select the bar chart icon to switch the report to a bar chart.
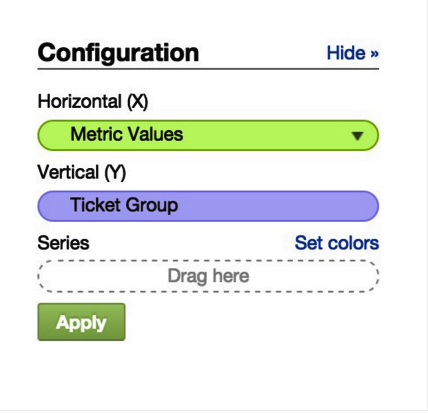
- Click Show configuration .
- In the Configuration section, move Metric Values to the X Axis and Ticket Group to the Y Axis.
- Click Apply.
- In Advanced configuration, select Global Settings.
- Select the Data Labels and Boxed option.
- Deselect the Gridlines option.
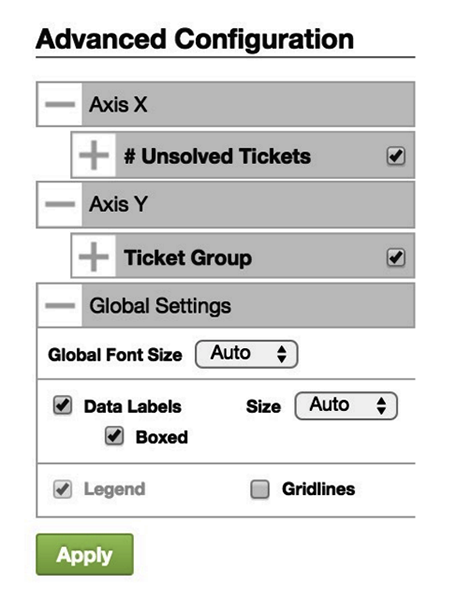
- Click Apply.
- Click Create to save your report for later use.
Comments
0 comments
Please sign in to leave a comment.