
Insights has now been removed for most customers. If you used Insights before, you'll now need to move to Explore, the latest generation of reporting for MorgWard products.
This report will help you measure the amount of time between when a ticket is created to when it is solved for the last time.
Skill level: Basic
Time required: 5 minutes
Ingredients: One built-in metric, one attribute.
Building your report
- Click the Reporting icon (
 ) on the sidebar in the agent interface, then click the Insights tab.
 - Click the GoodData link in the top right corner.
- In GoodData, select Reports> Create a report.
- In the What panel, select Full Resolution Time [Mdn] in either hours (hrs) or in minutes (min).
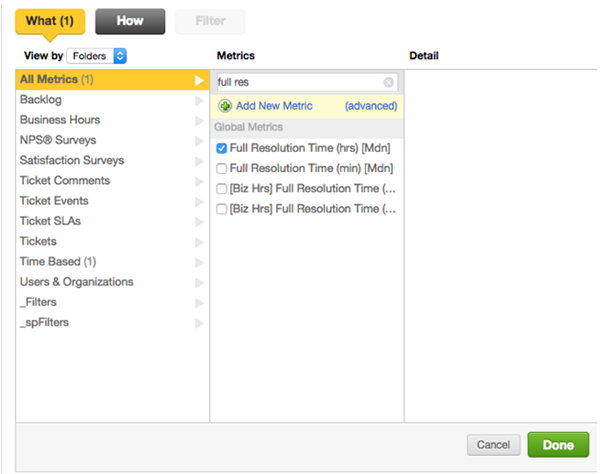
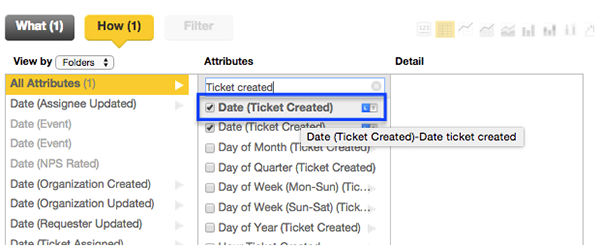
- In the How panel, you can select attributes to slice your data. For example, you can select Date (Ticket Created) to see the full first resolution time by day.
- Click Done.
This will give you the full resolution time for all tickets created per day for every day that a ticket was created in your MorgWard.
Customizing your report
To make your report more digestible, you can filter ticket results and select different chart types to represent your data. For example, you can filter ticket results to a specific month and select a line chart to show the increase or decrease in resolution time during that month.
- In the Filter panel, select the List of values option.
- Select Month/Year (Ticket Created) as the attribute to filter.
- Select a month and year to analyze.
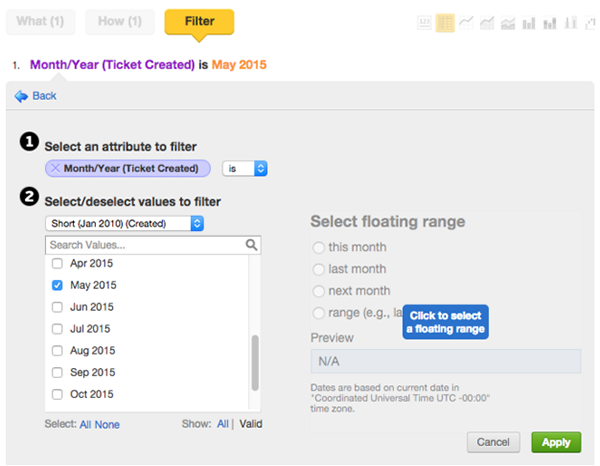
- Click Apply.
- Select the line chart symbol (
 ) at the top right of the report editor.
 - Your report will now be displayed as a line chart.
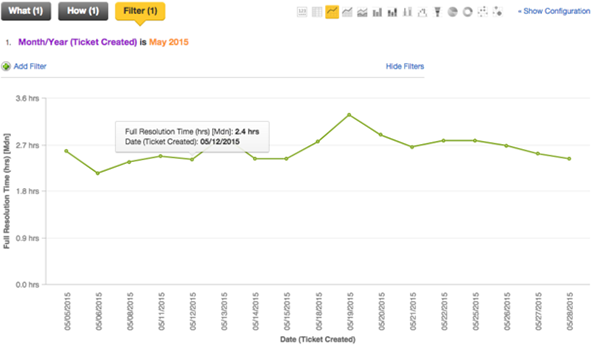
- Click Create to save your report.

After you click Create, you can add your report to dashboards, sort it into a folder, or share it with others. For more information see, Sharing reports in Insights and Creating reports and dashboards in Insights. For more Insights resources see, Insights resources.
Comments
0 comments
Please sign in to leave a comment.