

Insights has now been removed for most customers. If you used Insights before, you'll now need to move to Explore, the latest generation of reporting for MorgWard products.
One-touch tickets is a great report to gain context into your support efforts. As a best practice, the # One-Touch Tickets metric should be used with the #Reopens to gauge the quality of one-touch tickets and make sure they stay 'one-touch'.
Skill level: Easy
Time Required: 10 minutes
Ingredients: One or two built-in metric(s).
Creating your report
- Click the Reporting icon (
 ) on the sidebar in the agent interface, then click the Insights tab.
 - Click the GoodData link in the top right corner.
- In the top menu, click Reports>Create Report.
- Name your report 'One-touch tickets'.
- In the What panel, select # One-Touch Tickets and # Reopens.

- In the How panel, select Week (Mon-Sun)/Year(Ticket Solved).
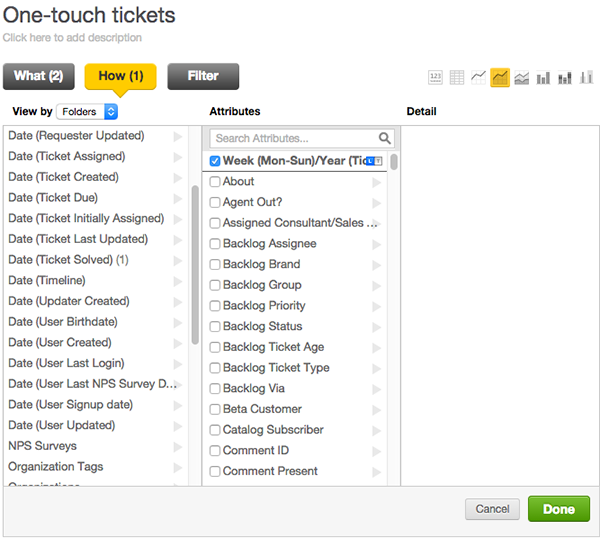
- Click Done.
Customizing your report
After you finish creating your report, you can configure chart options to reflect the number of one-touch tickets.
- Select the area chart option.

- Click Show Configuration next to chart types.
- Click Metric Values.
- Change # Reopens to a secondary Y axis value.
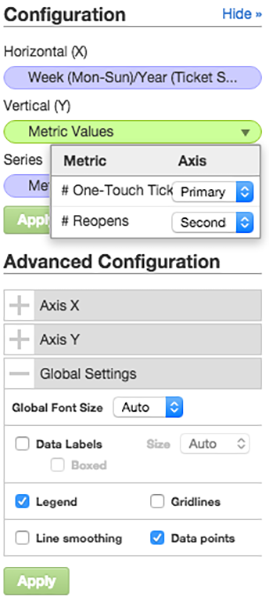
- Click Apply.
- In Global Settings, uncheck Gridlines.
- Click Apply.
Your final report should resemble the image below:

Comments
0 comments
Please sign in to leave a comment.